
The Year is 2069 – hedge funds are a thing of the past. The stock market exists for the sole purpose of backing up the Brinks Truck. Dogecoin is the only legitimate currency. DeepFuckingValue is the President of the United States. A new day shines on the world… Life is good : )
It’s only right that starting a new year with get-rich-quick schemes and making fucking stacks is the literal “hot in the streets” item. If you haven’t lived under a rock, a bridge, or got permabanned from the internet like Steve Cohen’s Twitter account, you know that the internet community r/WallStreetBets has staged siege after siege on elephantine hedge funds that short sell stocks of dying companies. The movement has become so huge, that everyone – from some random guys with only a broken Camaro and $3 to their name, to my personal lord and savior Dave Portnoy, have stepped up to the plate to put the Wall Street “suits” in their place. The terms “to the moon” and “hold the line” are now ingrained into our smooth-brained heads, and I will certainly be screaming several of those phrases when I’m playing my next game of flip cup. Let’s be warned that the first person to say “to the moon” was JFK and his head is now in several pieces scattered somewhere in the Dallas-Forth Worth Metro Area.
The other side of this story is the, frankly, illegal actions of retail trading platforms, mainly Robinhood, whose sole purpose was to provide seamless public access to the markets… well that was fucking lie. Robinhood CEO and literal Tommy Wiseau look alike Vlad Tenev has all of the suits in his pockets and shut down trading of stocks that raw-dogged the finance bros to the verge of bankruptcy. Robinhood – the hero that stole from the rich and gave to the poor – seems to have played the “Trump” card a little too early just to further the claim of being the antithesis of its namesake. Unfortunately, in today’s society, everything is a joke till it’s not. And when the Robinhood app suddenly decided from thin air to ban the sale of GameStop shares among several, the internet literally one-star reviewed the app all the way down to the depths of the Devil’s cloaca just to “print some tendies” and rocket the stock to Uranus by the end of the day.

At the end of the week, I find myself uncomfortably leveraged in GameStop shares to the point I may never be able to financially recover from this. Do I care?… No. This is the equivalent of going to the SuperBowl and I’d rather spend 3 racks on being part of a revolution rather than Roger Goodell’s pseudoscience circus. Buying meme stocks is the flexing airpods equivalent of 2020 – if you’re not a part, pull out your Blackberry from your JNCO jeans and buy “real stocks”.
The stock market has seemingly turned into a no rules, cutthroat, eat or be eaten sort of hellscape where only people that plunge their entire family savings or their upcoming stimmy somehow YOLO their way to a $10 profit. The conventional rules of the finance world don’t seem to apply, while the phrase stocks only go up has been spoken and repeated into existence like mountaintop monks trying to master the art of air bending.
Meme stocks follow well established financial trends and indicators just like any other stocks and can still be used to trade your way to tendies. Let’s take a look at managing risk.
To YOLO or not to YOLO, that is the Question?
The stock market is the biggest game of chicken that you play with yourself and is most comparable to the decisions you make whether you really want to go out drinking one night and wake up hungover on a Wednesday. For example, some questions one asks themselves before making this decision –
- Who’s going out tonight?
- What bars am I going to?
- When will I get back?
- Do I need to be a competent human being the following day?
All of these questions can be answered with a simple trading indicator called the Relative Strength Index (RSI). The RSI indicates whether or not shares are overbought or oversold at a point in time. Generally, RSI is measured on a scale of 0 to 100, with any number below 30 generally signifying oversold, while numbers greater than 65 mean overbought. Let’s dive into an example –
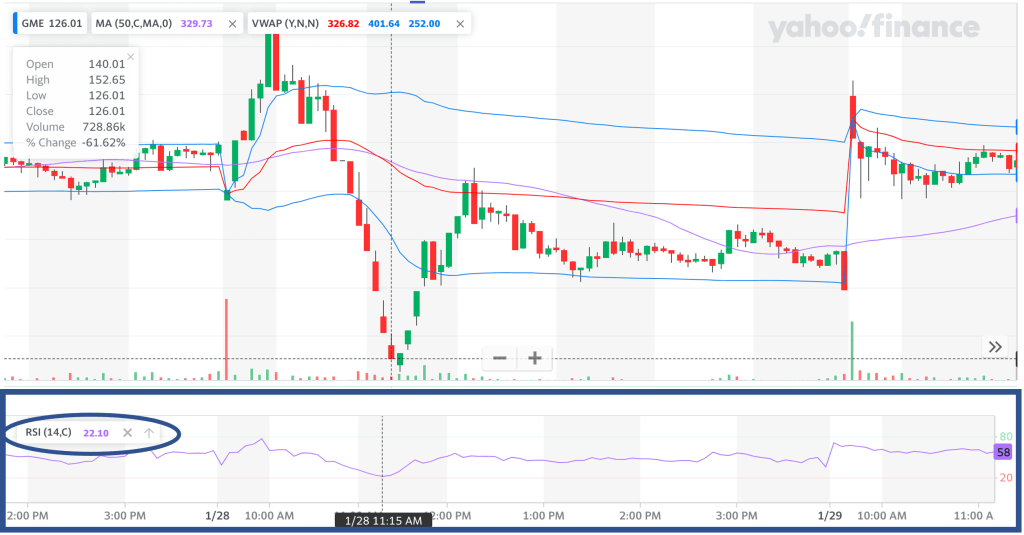
Here’s a 1-day trading cycle on GameStop on 1/28 during the heat of this week’s trading. RSI can be turned on in the indicators section in Yahoo Finance (blue box above), and the limits for overbought and underbought are set as 80 and 20 (in green and red) respectively. This shit is literally so easy. Around 11:15am, the RSI value is 22.10, close to the threshold of underbought, and literally right on cue the stock price surges. Pretty similar to what happens at around 10am as well, the stock is overbought, approaching RSI = 80, and the stock plummets. It’s simple supply and demand and is an excellent way of knowing when to take the plunge and assess risk.
The RSI is a RELATIVE indicator, meaning its values change based on the time interval and date range set. Therefore, not only is this a genius way of day trading but can also be a valuable tool for long term investing.
What’s the Relationship between Gravity, a Pregame, and the Stock Market?
Nothing can be achieved without the concept momentum. Without momentum, everything is pretty much just luck if you think about it. Fortunately, the first conceptualized thought to doing literally everything is the small stream that turns into a raging river. That is, after all, the concept of gravity, a pregame, or the stock market. It may be one small step for man, one giant leap for your liver.
Riding up and down in the stock market is a game of momentum, and a trader needs to know when momentum in the buying or selling direction is highest to make smart plays. Enter the Moving Average Convergence Divergence (MACD). There’s a lot of fancy math and moving averages that must be calculated when forming the MACD, but frankly being able to read the chart is the most important skill. An example –

Shifting to stocks that aren’t just meme stocks. Here’s a 1-day trading cycle of AMD, one of my personal favorites and one I’m heavily leveraged in. The MACD (blue box above) consists of two separate lines, the MACD line (purple) and the signal line (orange). Large selling momentum is dictated by the signal line being above the MACD line, while buying momentum is signified by MACD line being above the signal line. Therefore the takeaway – using the intersections of the two lines can help traders pinpoint buying or selling momentum (in other words local maximum and minima of stock price). For example, the intersection between 12:30 and 1pm (red asterisk) signifies and end to selling momentum and into buying.
Using the RSI and the MACD are two of the easiest ways to make a profit especially when it comes to timing the markets. Old hat, inexperienced boomer investors are keen on saying “Time in the market is greater than timing the market”. I personally could give a horse’s ass about that statement because the stock market is, and always will be the world largest free casino so going to Vegas now versus 5-years is only going to do me like 10% good when in reality I want to retire when I’m 40 years old in Bora Bora as a photographer taking horrible pictures of people on their honeymoons.
Oh shit I’ve ran out of characters and it’s 3AM and not even scratched the surface … Part 2 coming soon?

Leave a comment